

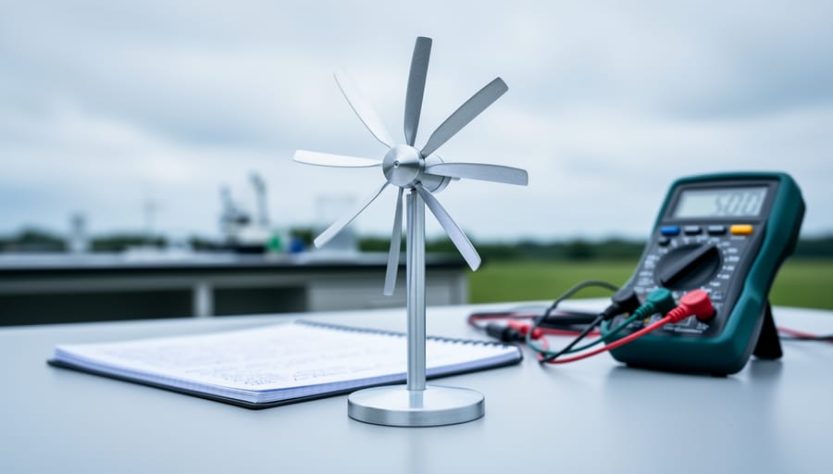
A successful wind turbine science project begins with a testable hypothesis that predicts how a specific variable will affect energy output, rotor speed, or efficiency. Students typically frame these as “if-then” statements: if blade angle increases beyond 15 degrees, then rotational speed will decrease because airflow separation reduces lift. This structured approach transforms a simple windmill demonstration into a rigorous scientific investigation that mirrors the optimization challenges engineers face in commercial wind farms.
Formulating an effective hypothesis requires understanding three core relationships in wind energy: how blade design influences aerodynamic efficiency, how wind speed correlates with power generation, and how mechanical variables like rotor diameter or gear ratios affect energy conversion. The strongest hypotheses isolate one independent variable, predict a measurable outcome, and explain the physical mechanism behind that prediction. This methodical thinking prepares students to test real-world scenarios, from comparing three-blade versus six-blade configurations to exploring how tower height impacts performance in turbulent conditions.
The value of this exercise extends beyond classroom grades. Wind energy now provides more than 10% of global electricity, and the sector continues to expand as countries pursue carbon-neutral targets. Students who master hypothesis formulation in turbine projects develop analytical skills directly applicable to renewable energy careers. They learn to think like researchers: questioning assumptions, controlling variables, and using data to validate or refine their predictions. Whether testing a small desktop model or a larger outdoor prototype, the discipline of hypothesis-driven experimentation builds scientific literacy and demonstrates why wind remains one of the fastest-growing clean energy sources worldwide.
Understanding Wind Turbine Variables for Your Hypothesis
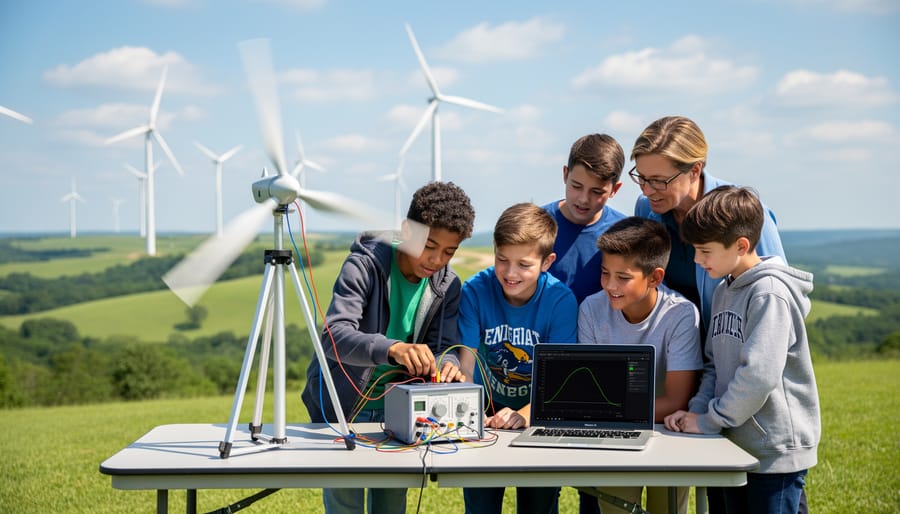
Before you can craft a meaningful hypothesis, you need to understand which factors in a wind turbine system you can actually change and measure. Think of these as the knobs and dials of your experiment, some you’ll adjust deliberately, others you’ll measure as results, and still others you’ll keep constant to ensure fair testing.
Independent Variables: What You Can Change
The independent variable is what you deliberately manipulate to see how it affects turbine performance. Blade design represents one of the richest areas for experimentation. You might test flat blades versus curved airfoil shapes, or compare materials like cardboard, plastic, and balsa wood. Each design interacts with wind differently, affecting how efficiently it captures energy.
The number of blades offers another straightforward variable. While commercial turbines typically use three blades, student projects can compare anywhere from two to six blades to explore the trade-off between wind capture and rotational resistance.
Turbine height matters because wind speed increases with elevation, even in small increments. Testing a turbine at table height versus one meter higher can yield measurable differences.
Blade angle, or pitch, determines how aggressively blades intercept the wind. Angles between 10 and 45 degrees produce vastly different results, making this an excellent variable for precise experimentation.
Dependent Variables: What You Measure
Your dependent variable is the outcome you observe and record. For wind turbines, this typically means electrical output (voltage or current from the generator), rotational speed measured in RPM, or starting torque, the minimum wind speed needed to begin spinning.
Controlled Variables: What You Keep Constant
These are the factors you must hold steady to ensure your results reflect only the independent variable’s effect. If you’re testing blade number, you need consistent wind speed for each trial, either natural wind measured with an anemometer or artificial wind from a fan set to the same speed and distance. Generator type must remain identical across tests, since different motors produce different voltage outputs. Even the testing environment matters: indoor tests eliminate weather variability that outdoor setups introduce.
Understanding these variable categories transforms vague curiosity (“I wonder if more blades work better”) into testable science (“If I increase blade count from three to five while keeping wind speed, blade length, and generator constant, then voltage output will increase by a measurable amount”). This precision is what separates successful science projects from disappointing ones.
Materials and Tools You’ll Need
Building a functional wind turbine test platform doesn’t require expensive equipment, though you’ll need specific items to collect meaningful data for your hypothesis. The materials fall into three categories: construction components, measurement instruments, and documentation tools.
For the turbine structure itself, gather lightweight construction materials that allow for easy modification. Cardboard works well for blade prototypes, letting you quickly test different shapes and sizes. Small DC motors (3-6 volt hobby motors) serve as generators and cost just a few dollars at electronics stores. PVC pipe or wooden dowels (¼ to ½ inch diameter) make sturdy turbine shafts, while corks or foam blocks provide simple mounting hubs. You’ll also need basic fasteners like hot glue, tape, or small bolts, plus a stable base such as a wooden board or plastic container weighted with sand.
Your measurement toolkit determines how precisely you can test your hypothesis:
Construction Materials:
– Cardboard, balsa wood, or foam board for blades (various thicknesses)
– Small DC motors (3V or 6V) to convert wind energy into electrical output
– PVC pipe, wooden dowels, or metal rods for the turbine shaft
– Cork, foam, or 3D-printed hubs to attach blades
– Hot glue gun, tape, screws, or epoxy for assembly
– Weighted base platform for stability during testing
Measurement Tools:
– Multimeter to measure voltage and current output (digital models under $20)
– Anemometer for wind speed measurement (handheld or smartphone app versions available)
– Tachometer or smartphone app to measure rotational speed (RPM)
– Ruler, protractor, and calipers for precise blade measurements
– Scale to weigh components and loads
Documentation Supplies:
– Notebook or lab journal for recording observations
– Camera or smartphone for photographing blade designs and test setups
– Graph paper or spreadsheet software for organizing data
Advanced projects might add LED bulbs or small resistors as standardized loads, a fan with adjustable speeds for controlled wind simulation, or a wind tunnel constructed from cardboard boxes. Start with basic tools and expand your equipment as your hypothesis demands more precise measurements.
Safety Considerations for Wind Turbine Experiments
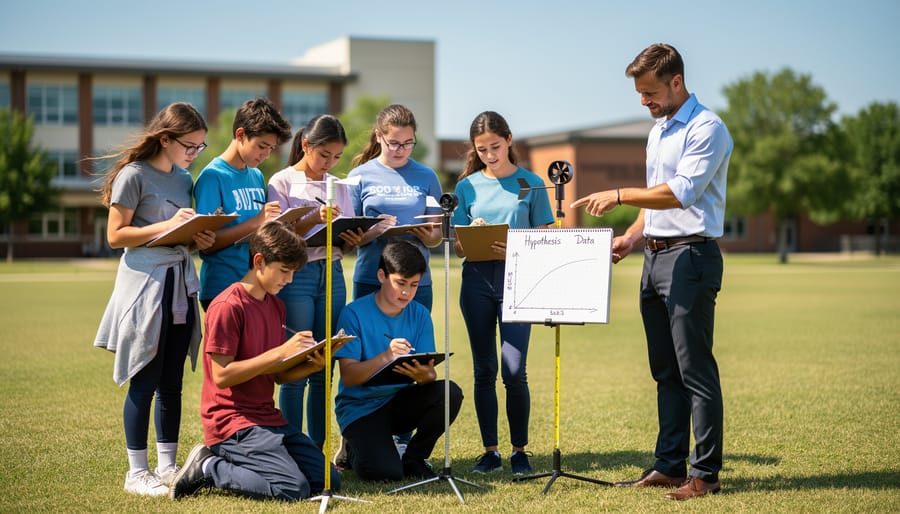
Before you begin building and testing, take these safety measures seriously. Even small-scale wind turbine experiments involve moving parts and electrical components that can cause injury if handled carelessly.
Electrical Safety
Generators produce real electricity, and mishandling wires or connections can result in shocks or short circuits. Always disconnect your generator before making adjustments to the turbine assembly. If your project involves batteries or capacitors for energy storage, understand proper polarity and never create direct short circuits. Younger students should work with low-voltage systems (under 12 volts) and have an adult verify all electrical connections before testing begins. When learning how wind turbines work the electrical generation component deserves particular respect.
Protective Equipment and Workspace Setup
Wear safety glasses whenever your turbine is spinning. Blades rotating at even moderate speeds can shatter if they strike an object, sending fragments toward your face. If you’re cutting or drilling materials for blade construction, use appropriate eye protection during fabrication as well. Clear a workspace with at least three feet of clearance around your turbine in all directions. Secure your turbine base to prevent tipping, especially when using fans or leaf blowers to simulate wind. Keep loose clothing, hair, and jewelry away from rotating components.
Age-Appropriate Supervision
Elementary students require direct adult supervision throughout all phases of construction and testing. Middle school students can work more independently but need adults present during powered testing and when using tools. High school students conducting advanced projects with higher voltages or larger turbines should still consult with teachers or mentors on safety protocols before beginning experiments.
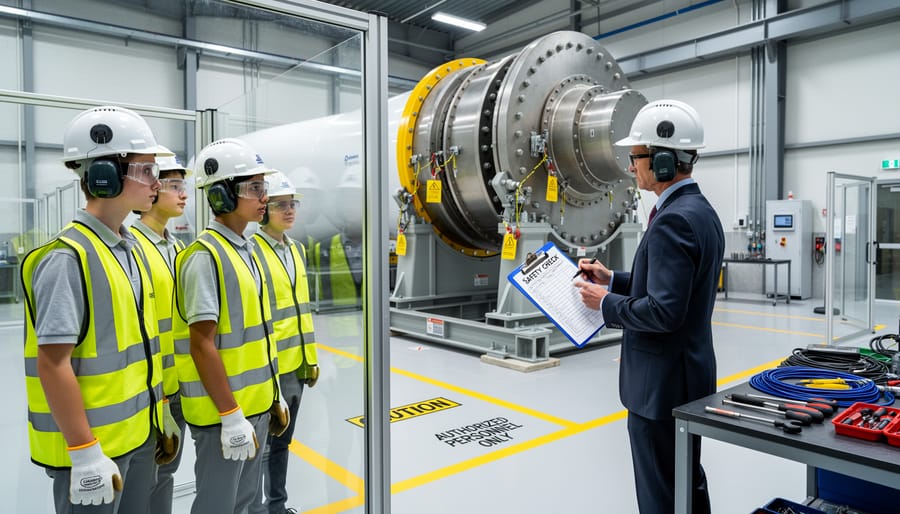
Step-by-Step Process for Creating Your Hypothesis
Step 1: Choose Your Research Question
Your research question sets the foundation for your entire wind turbine project, so choose one that’s specific enough to answer through testing. Start by observing what interests you most about wind turbines, how they spin, what makes them efficient, or how different designs perform.
A strong research question focuses on one relationship between two things you can measure. Ask yourself: “What am I curious about?” and “Can I actually test this with the materials I have?” Questions like “Does blade shape affect power output?” or “How does wind speed impact turbine rotation speed?” work well because they target a single, testable relationship.
Avoid questions that are too broad or philosophical. “How do wind turbines work?” won’t lead to a testable hypothesis, it’s more of a research topic. Similarly, “What’s the best wind turbine design?” lacks specificity because “best” depends on many unmeasured factors.
Good questions typically start with “How does…” or “What is the effect of…” For example: “How does the number of blades affect rotation speed at constant wind speed?” This question clearly identifies what you’ll change (blade number), what you’ll measure (rotation speed), and what you’ll keep the same (wind speed).
Step 2: Conduct Background Research
Before you can write a strong hypothesis, you need to understand what other researchers and engineers have already discovered about wind turbine performance. This background research prevents you from repeating known experiments and helps you build on established scientific knowledge.
Start with educational resources designed for students. The Department of Energy’s Office of Energy Efficiency & Renewable Energy offers accessible explanations of wind power principles, while university engineering department websites often publish simplified guides to turbine aerodynamics. Your school or public library can provide access to databases like JSTOR or Google Scholar, where you can search for peer-reviewed studies on wind energy using student-friendly filters.
When reviewing existing studies, pay attention to three key elements: the variables researchers tested, their experimental methods, and their findings. Look for patterns in the data and note any conflicting results, which can reveal promising areas for your own investigation. Take notes on specific measurements other experimenters used, as these will guide your own data collection approach.
For middle school projects, focus on overviews and summary articles. High school students should aim to read at least two or three primary research papers, even if you only fully understand the introduction and conclusion sections. This exposure to scientific literature builds critical reading skills essential for advanced STEM work.
Step 3: Identify Your Variables
Variables are the foundation of any testable hypothesis. For your wind turbine project, you need to identify three types: the independent variable (what you’ll change), the dependent variable (what you’ll measure), and controlled variables (what you’ll keep the same).
Start by choosing one independent variable to manipulate. If you’re testing blade number, that’s your independent variable, you might test turbines with 2, 3, 4, and 6 blades. Your dependent variable is the outcome you’ll measure, typically power output in volts or rotational speed in RPM. Some projects measure energy efficiency or startup wind speed instead.
The controlled variables are everything else that could affect your results. Keep constant: blade material, blade length, turbine height, generator type, wind source distance, and testing duration. If you change blade number but also change blade shape, you won’t know which variable caused your results.
Write your variables down clearly before proceeding. For example: “Independent variable: number of blades (2, 3, 4, 6). Dependent variable: voltage output. Controlled variables: 6-inch blade length, cardboard material, DC motor generator, 12-inch fan distance, 30-second test runs.”
This clarity prevents confusion during testing and makes your hypothesis precise.
Step 4: Write Your Hypothesis Statement
With your variables identified, translate them into a clear hypothesis statement using the if-then format: “If [I change the independent variable], then [the dependent variable will respond in a specific way] because [scientific reasoning].”
Start with the independent variable you’ll manipulate. Write “If I increase/decrease/change [specific variable]…” Be precise, instead of “if I change the blades,” write “if I increase the number of blades from three to six.”
Next, predict the specific outcome. Complete the statement with “then [measurable result] will increase/decrease/remain constant.” For example: “then the voltage output will increase” or “then the rotational speed will decrease by at least 20%.”
The optional “because” clause strengthens your hypothesis by showing you understand the science. “…because more blades will capture more wind energy” demonstrates you’ve connected cause and effect, not just guessed.
Here are three well-constructed examples:
“If I increase the number of blades from two to six, then the electrical voltage generated will increase, because additional blades capture more wind energy per rotation.”
“If I change the blade material from cardboard to lightweight plastic, then the turbine will spin faster at the same wind speed, because plastic blades have less air resistance and greater rigidity.”
“If I increase the turbine height from one meter to two meters above ground level, then the power output will increase by at least 15%, because wind speed increases with height due to reduced ground friction.”
Each hypothesis identifies one variable to change, predicts a measurable outcome, and explains the underlying physics.
Examples of Strong Wind Turbine Hypotheses
Here are five strong wind turbine hypothesis examples that demonstrate how to clearly link a single variable to measurable outcomes:
Blade Number Hypothesis: “If a wind turbine has four blades instead of three blades, then it will generate more electrical current at the same wind speed because the additional blade surface area will capture more wind energy.” This hypothesis works because it isolates blade count as the only changing variable while keeping blade shape, size, and wind speed constant. The predicted outcome (higher current) can be measured precisely with a multimeter.
Blade Shape Hypothesis: “If wind turbine blades have a curved airfoil shape rather than flat rectangular blades, then the turbine will spin faster at wind speeds between 5-10 mph because the curved design creates lift similar to an airplane wing.” This example specifies both the independent variable (blade shape) and the dependent variable (rotation speed), while also defining the testing conditions (specific wind speed range). The physics principle behind the prediction makes it scientifically grounded.
Turbine Height Hypothesis: “If a wind turbine is positioned at 2 meters above ground level instead of 0.5 meters, then it will produce 30% more power because wind speed increases with height due to reduced ground friction.” Notice how this hypothesis includes a specific percentage prediction, making the results easier to evaluate. The underlying principle about wind speed gradients adds depth to a seemingly simple height comparison.
- Wind Speed Hypothesis: If wind speed increases from 5 mph to 10 mph, then voltage output will double because kinetic energy in moving air increases exponentially with velocity
- Blade Angle Hypothesis: If turbine blades are angled at 15 degrees to the wind rather than 30 degrees, then rotational speed will increase by 25% because the optimal angle of attack maximizes lift while minimizing drag
Each of these hypotheses demonstrates the essential components: a clearly stated independent variable, a specific dependent variable you can measure, and a logical explanation connecting cause to effect. They avoid vague language like “works better” in favor of quantifiable predictions such as percentage increases, specific measurements, or comparative speed changes.
Testing and Verifying Your Hypothesis
With your hypothesis written, it’s time to design an experiment that will produce meaningful results. The goal is to create conditions where only your independent variable changes while everything else stays constant, this is what makes your test fair and your conclusions valid.
Start by setting up controlled conditions. If you’re testing blade number, for instance, build multiple turbines identical in every way except the number of blades. Keep the blade material, length, generator, and mounting height the same across all test turbines. Use the same wind source (a fan works well) at the same distance and setting for each trial. This control ensures that any performance difference you observe comes from blade number alone, not from other variables sneaking in.
Determine your sample size before testing begins. One measurement isn’t enough, random variations happen. For student projects, conduct at least five trials per configuration and calculate the average. If you’re testing three different blade counts, that’s fifteen total trials minimum. This repetition helps you spot patterns and filter out flukes. Record every measurement, even ones that seem odd; outliers sometimes reveal important insights about your setup.
Collect data systematically using the same measurement method each time. If you’re measuring voltage output, use the same multimeter positioned identically for every trial. Record your observations in a data table with columns for trial number, configuration being tested, and measurement results. Note any unusual conditions, a gust from an open window, a loose blade connection, that might affect that particular trial.
Once you’ve collected your data, analyze what it tells you. Calculate averages for each configuration and look for clear patterns. If your hypothesis predicted that four blades would generate more power than three, and your data shows consistently higher voltage readings for the four-blade design, your results support your hypothesis. If the three-blade design performed better, or if there’s no meaningful difference, your hypothesis is refuted, and that’s perfectly valid science.
Graph your results to make patterns visible. A simple bar chart comparing average performance across configurations often reveals trends more clearly than numbers alone. Look at the spread of your data points too; if measurements vary wildly, you might need to improve your experimental setup or increase your sample size.
Next Steps: Expanding Your Wind Power STEM Project
After testing your hypothesis, you’ve completed one cycle of scientific inquiry, but that’s just the beginning of a deeper exploration into wind power. The next logical step is refinement. Modify one aspect of your original experiment: if you tested three blades versus four, now examine five or six. If you explored blade angle, try different materials or surface textures. Each iteration sharpens your understanding of the variables that drive turbine efficiency.
Consider expanding into related questions that connect your small-scale project to larger energy systems. How would your findings scale to commercial turbines? What happens when you integrate battery storage into your setup? Exploring energy storage innovations helps you understand why renewable storage technology matters as much as generation capacity. You might investigate how wind variability affects power output consistency, or how turbine placement influences performance in different environments.
Documentation becomes critical if you’re preparing for science fairs or competitions. Photograph each experimental stage, maintain detailed data logs with timestamps, and create clear graphs showing your results. Organizations like the International Science and Engineering Fair (ISEF) and Regeneron Science Talent Search accept renewable energy projects through 2026, with application deadlines typically in January. Your local science fair coordinator can provide specific submission requirements.
Connect your work to current industry developments by researching how engineers solve the same problems you encountered. Reading about renewable energy trends reveals that blade optimization, placement strategies, and efficiency improvements remain active research areas. Your hypothesis-driven approach mirrors the methodology professionals use to advance wind technology, making your project more than an academic exercise, it’s hands-on participation in solving real energy challenges.
Frequently Asked Questions
Can I test multiple variables in one experiment?
No, you should test only one variable at a time while keeping all others constant. Testing multiple variables simultaneously makes it impossible to determine which change caused your results, undermining the scientific validity of your hypothesis.
What if I don’t have expensive equipment to measure power output?
You can measure simpler indicators like how many seconds it takes to lift a small weight, how fast the blades spin at different wind speeds, or how far a ribbon attached to the turbine extends. These indirect measurements still allow you to collect meaningful data and test your hypothesis effectively.
How long should I spend testing my hypothesis?
Plan for at least three to five trials for each condition you’re testing, which typically takes several days to complete. This repetition helps ensure your results are reliable rather than random fluctuations, and gives you enough data to identify clear patterns.
What makes a hypothesis too simple or too complex for a student project?
A too-simple hypothesis merely restates an obvious fact without meaningful testing, such as “wind makes turbines spin.” A too-complex hypothesis involves variables you can’t control or measure with available resources, like testing turbine efficiency across different atmospheric pressure levels. Aim for a hypothesis that challenges you to collect real data but stays within your equipment and time constraints.
Do professional wind farms use the same hypothesis-testing approach?
Yes, engineers developing commercial wind farms conduct similar experiments at much larger scales to optimize turbine design and placement. Learning this process now connects your classroom project to real-world renewable energy development, similar to how countries like those expanding Germany’s renewables infrastructure rely on systematic testing before deploying new technologies.
Should I change my hypothesis if my initial results don’t match my prediction?
No, don’t change your original hypothesis after seeing results. Instead, analyze why your prediction was incorrect and use that learning to develop a new hypothesis for future experiments. Unexpected results often teach more than confirmed predictions and represent valuable scientific discovery.
These questions reflect the real challenges students encounter when moving from theory to hands-on experimentation. The answers prioritize practical solutions over perfect laboratory conditions, recognizing that most school projects work within significant resource constraints. Understanding that hypothesis testing is an iterative process prepares students for genuine scientific thinking, where initial predictions frequently miss the mark but still advance knowledge through careful observation and analysis.
Developing a well-crafted hypothesis for your wind turbine science project is more than an academic exercise. It’s your entry point into understanding the engineering principles that power millions of homes worldwide through renewable energy. Every professional wind farm optimization started with the same fundamental question-and-test cycle you’re practicing now.
The hypothesis-driven approach you’ve learned here mirrors how real wind energy engineers solve problems: identify a specific variable, predict an outcome based on physical principles, test methodically, and analyze results honestly. Whether your data confirms or contradicts your initial prediction, you’ve gained valuable insight into aerodynamics, energy conversion, and the scientific method itself.
Start simple. A straightforward hypothesis about blade number or angle is perfectly valid for your first experiment. You can always expand to more complex variables, multiple blade shapes, turbine height interactions, or generator efficiency, in future iterations. Each project builds your intuition about how wind turbines actually work, knowledge that directly translates to understanding utility-scale wind power.
Your classroom or garage experiment contributes to something larger: widespread renewable energy literacy. As climate concerns intensify and wind installations expand globally, society needs citizens who understand both the potential and practical limitations of these technologies. You’re building that foundation now.
Ready your materials, formulate that hypothesis, and start testing. The data you collect will surprise you, challenge your assumptions, and deepen your appreciation for the elegant complexity of capturing wind’s energy.