
The planet’s energy infrastructure stands at a crossroads. Global temperatures have risen 1.1°C above pre-industrial levels, extreme weather events now cost the global economy over $200 billion annually, and fossil fuel price volatility continues to destabilize national budgets. Yet we possess a solution that has matured from experimental technology into the fastest-growing energy source in human history.
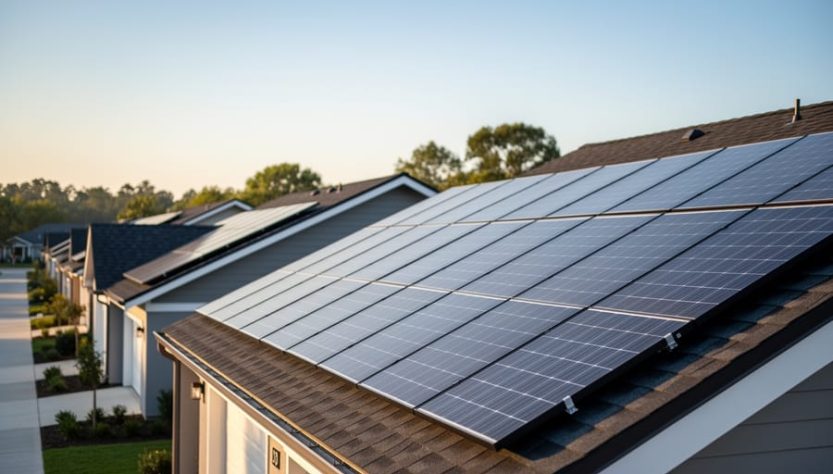
Solar energy has transitioned from an idealistic alternative to an economic imperative. Installation costs have plummeted 89% since 2010, making solar the cheapest electricity source in most countries. The technology now converts sunlight to electricity at efficiencies exceeding 26% in commercial applications, with residential systems paying for themselves in 6-8 years across most markets. More than 1.3 terawatts of solar capacity operate worldwide, preventing approximately 1.5 billion tons of carbon dioxide emissions each year.
The case for solar extends beyond environmental necessity. Energy independence has become a national security priority as geopolitical tensions disrupt traditional fuel supplies. Homeowners and businesses now generate their own electricity, insulated from grid failures and price spikes. The solar industry employs over 4 million people globally, creating jobs that cannot be outsourced and revitalizing local economies.
This convergence of climate urgency, economic advantage, and technological maturity creates an unprecedented opportunity. Countries leading solar adoption report measurable improvements in air quality, public health outcomes, and energy resilience. The question has evolved from whether solar makes sense to how quickly we can deploy it at scale. The evidence reveals not just why solar energy matters, but why delaying its adoption carries costs we can no longer afford.
The Economics Have Fundamentally Shifted
Solar vs. Fossil Fuels: The Crossover Point
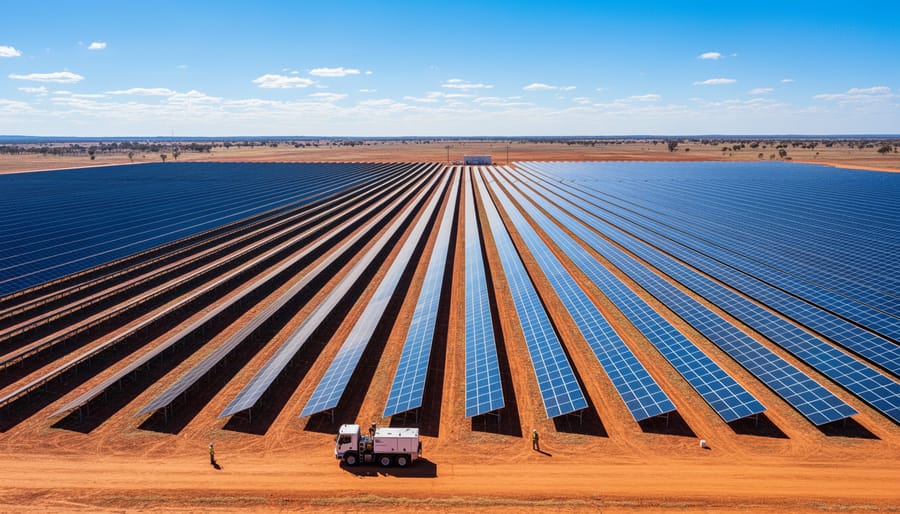
The 2024 data marks a definitive turning point: utility-scale solar now generates electricity at $24, $96 per megawatt-hour across most markets, compared to $39, $101 for natural gas and $65, $152 for coal, according to Lazard LCOE+ grid parity analysis. This represents a 90% cost decline for solar over the past decade, while fossil fuel prices have stagnated or risen. In India, new solar projects consistently bid below ₹2 per kilowatt-hour, undercutting coal by 20-40%. China’s average solar auction prices fell to $0.015 per kilowatt-hour in 2023, making it the cheapest electricity source nationwide. The United States saw unsubsidized solar reach $0.03, $0.04 per kilowatt-hour in Texas and California, cheaper than existing natural gas plants in many hours.
The crossover extends beyond generation costs. When factoring in transmission, storage, and grid integration, solar-plus-storage systems now compete directly with gas peaker plants in over 60% of U.S. markets. Middle Eastern nations historically dependent on oil are building solar farms at $0.0135 per kilowatt-hour, the lowest recorded globally. Projections show solar maintaining a 5-15% cost advantage through 2030 as manufacturing scales and fossil fuel extraction becomes more expensive.
The Hidden Financial Multipliers
Beyond the direct cost savings, solar energy generates substantial economic benefits that most analyses overlook. Energy independence stands at the forefront: households and businesses with solar installations insulate themselves from utility rate fluctuations that have historically averaged 2-3% annually but can spike dramatically during supply disruptions. In 2022-2023, conventional electricity prices jumped 15-30% in many markets while solar owners maintained stable, predictable energy costs.
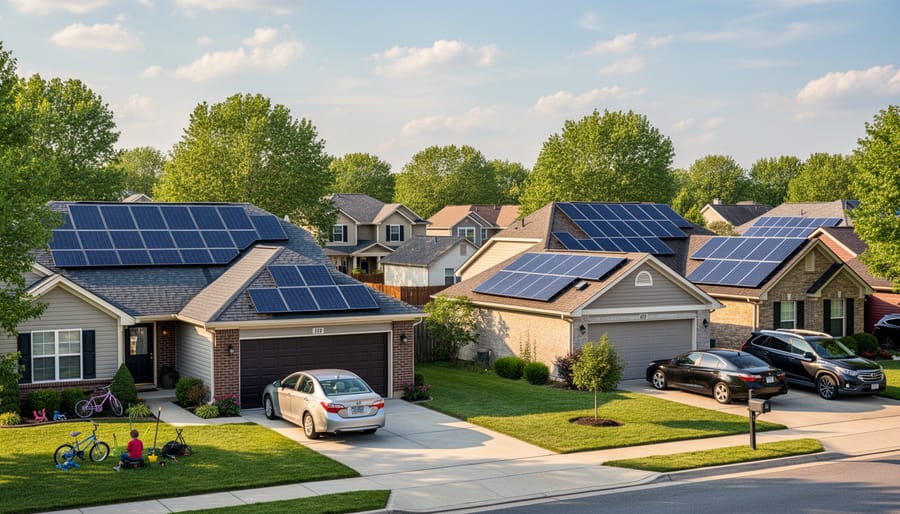
Property values reflect this premium. Multiple studies confirm that homes with solar installations sell for 4-6% more than comparable properties without them. In practical terms, a home valued at $400,000 gains $16,000-$24,000 in resale value from a typical residential solar system that costs far less after incentives. The payback calculation becomes even more favorable when factoring this equity increase alongside monthly utility savings.
The employment multiplier deserves equal attention. The solar industry now employs over 250,000 workers in the United States alone, growing at roughly 5-7 times the national average job creation rate. These positions span manufacturing, installation, maintenance, and engineering, with median wages exceeding many traditional energy sector roles. For every megawatt of solar capacity installed, economic analyses estimate 4-6 direct jobs and an additional 8-10 indirect positions throughout the supply chain.
These financial multipliers compound over time, transforming solar from a simple utility substitution into a wealth-building asset that strengthens local economies while delivering energy security.
Climate Impact by the Numbers
What the Latest IPCC Data Reveals
The IPCC’s Sixth Assessment Report establishes that limiting warming to 1.5°C requires solar photovoltaics to supply 20-25% of global electricity by 2050, with interim targets of 8-10% by 2030. Current deployment stands at approximately 5.5%, meaning the next six years demand installation rates triple from present levels. The modeling scenarios that successfully restrict temperature rise position solar as the single largest contributor to decarbonization, outpacing wind, nuclear, and other low-carbon sources combined in most pathways.
The report’s latest data quantifies the carbon budget with stark precision: humanity can emit roughly 400 gigatons of CO2 to maintain a 50% chance of staying below 1.5°C. At current emissions rates, this budget depletes by 2032. Solar deployment emerges as the most scalable solution to bend this curve, capable of displacing 4-5 gigatons of CO2 annually once installed capacity reaches critical mass. Nations tracking toward ambitious renewable energy goals show emissions trajectories consistent with 2°C scenarios, but the 1.5°C target requires acceleration beyond current policy commitments, with solar expansion central to closing the gap between pledges and atmospheric realities.
Grid Reliability and Energy Security: The Emerging Picture

Case Study: How Germany and California Proved the Skeptics Wrong
Germany and California represent two of the world’s most rigorous stress tests for high solar penetration, and both have delivered compelling evidence that skeptics’ concerns were overblown.
Germany reached 32% solar and wind penetration by 2023, with solar accounting for roughly 12% of total electricity generation. The country’s grid stability actually improved during this period, with average interruption duration per customer falling to just 12.2 minutes annually in 2022, down from 15.3 minutes in 2015. Critics predicted blackouts and system collapse, yet Germany’s System Average Interruption Duration Index (SAIDI) remains among the lowest globally, better than the United States average of 214 minutes.
California hit 30% solar penetration in spring 2024, generating enough midday solar to power 10 million homes on peak days. The California Independent System Operator reported zero reliability-related blackouts attributable to solar variability between 2020 and 2023. The 2020 rolling blackouts that critics blamed on renewables actually resulted from inadequate solar energy storage capacity and failed forecasting, not solar generation itself. California responded by deploying 6.6 gigawatts of battery storage by 2024, proving the solution lies in complementary infrastructure.
Both regions demonstrated that successful high-penetration solar requires three elements: sophisticated forecasting systems, adequate renewable transmission capacity, and dispatchable backup resources. Germany’s success with cross-border interconnections allowed excess solar to flow to neighboring grids. California’s duck curve challenge, once considered insurmountable, now gets managed through a combination of battery storage, demand response programs, and improved grid software.
The lesson is clear: grid reliability concerns about solar are engineering challenges with proven solutions, not fundamental barriers. Both regions achieved stability metrics comparable to or better than conventional grids while dramatically reducing emissions.
Adoption Momentum: The Exponential Curve
Global solar capacity crossed 1,600 gigawatts in 2024, a milestone that took the industry 65 years to reach, yet experts project the next 1,600 GW will arrive in just four years. This acceleration isn’t linear; it’s exponential. Annual installations have surged from 115 GW in 2019 to an estimated 444 GW in 2024, representing a compound annual growth rate exceeding 30%. China alone deployed 216 GW in 2024, more than the entire world installed in 2019.
| Year | Global Additions (GW) | YoY Growth | Leading Contributors |
|---|---|---|---|
| 2019 | 115 | China, US, India | |
| 2020 | 139 | +21% | China, US, Vietnam |
| 2021 | 168 | +21% | China, US, India |
| 2022 | 239 | +42% | China, EU, US |
| 2023 | 346 | +45% | China, EU, Brazil |
| 2024 | 444 | +28% | China, US, India |
Investment flows tell the same story. Global solar investment reached $495 billion in 2024, overtaking oil and gas upstream spending for the second consecutive year. Utility-scale projects attracted $312 billion, but distributed solar saw the fastest growth at 41% annually, driven by commercial and industrial adoption.
Corporate procurement has become a major accelerant. Fortune 500 companies contracted 38 GW of solar capacity in 2024, triple the volume from 2020. Amazon, Google, and Microsoft collectively signed power purchase agreements for 14 GW, treating solar not as a sustainability gesture but as a cost-predictable electricity hedge. Walmart now operates solar on 568 facilities; Target on 542.
The trajectory indicates tipping points ahead. The International Energy Agency projects solar will constitute 25% of global electricity generation by 2030, up from 5.5% in 2023. Manufacturing capacity for panels, inverters, and trackers has scaled to support 1,100 GW of annual installations by 2028. Supply chains that took decades to build for fossil fuels are being replicated for solar in under a decade, and the capital is following proof of concept.
The Innovation Acceleration Factor
Solar panel efficiency has shattered previous boundaries, with laboratory cells now reaching 47.6% efficiency using multi-junction architectures, more than double the performance of panels from a decade ago. Commercial silicon panels have crossed the 25% efficiency threshold, making them viable for space-constrained installations that were previously impractical.
Perovskite solar cells represent the fastest-advancing photovoltaic technology in history. Their efficiency jumped from 3.8% in 2009 to over 26% by 2024, a trajectory that took silicon cells four decades to achieve. These materials can be printed onto flexible substrates, opening applications from building-integrated photovoltaics to portable power systems. Research teams have addressed earlier stability concerns, with some perovskite formulations now demonstrating 30-year operational lifespans in accelerated testing.
Bifacial panels capture reflected light from both sides, boosting energy generation by 15-30% depending on ground reflectivity and installation configuration. Their adoption has exploded, accounting for 48% of global module shipments in 2024 compared to 8% in 2019. Combined with tracking systems, bifacial installations achieve capacity factors exceeding 35%, approaching baseload generation profiles.
Tandem cell architectures stack perovskite layers onto silicon bases, theoretically pushing efficiency toward 45% for commercial applications. Oxford PV and other manufacturers have begun pilot production, with mass deployment expected by 2026. These advances mean future installations will generate substantially more power from identical footprints, reducing land requirements and improving project economics.
Emerging emerging renewable tech includes quantum dot cells, organic photovoltaics for specialty applications, and space-based solar concepts entering feasibility phases. The innovation pipeline remains exceptionally robust, with global R&D investment in photovoltaic technology reaching $8.2 billion annually. This acceleration creates a reinforcing cycle: each efficiency gain improves project returns, funding further research that unlocks additional breakthroughs.
What the Policy Landscape Tells Us
Government action in 2023-2024 has fundamentally reshaped solar economics. The U.S. Inflation Reduction Act alone allocated $369 billion for clean energy, with tax credits extending 30% for solar installations through 2032. First-year data shows this policy drove a 52% increase in utility-scale solar project announcements compared to 2022, while residential installations jumped 34% as homeowners capitalized on the extended incentives.
The European Union raised its 2030 renewable energy target to 42.5% of total consumption, requiring member states to add approximately 56 GW of solar annually, triple the 2022 installation rate. Germany’s revised Renewable Energy Act now mandates solar on all new commercial buildings and parking lots exceeding 35 spaces, while Spain introduced fast-track permitting that cut approval times from 18 months to under 90 days.
Emerging markets reveal the global scope. India’s Production-Linked Incentive scheme committed $2.4 billion to domestic solar manufacturing, targeting 65 GW of annual production capacity by 2026. China, already the world’s largest solar manufacturer, introduced provincial mandates requiring 40% renewable energy in new industrial parks. These policies align with updated solar industry standards that streamline installation practices across markets.
Brazil’s recent auction results demonstrate policy effectiveness: solar projects secured contracts at $20 per MWh, undercutting fossil fuels without subsidies. The country’s regulatory reforms allowing net metering for systems up to 5 MW unlocked distributed generation, adding 12 GW in 2023 alone, a 186% year-over-year increase.
These coordinated policy shifts create a self-reinforcing cycle. Subsidies drive deployment, which builds supply chains, which reduces costs, which makes future subsidies less necessary. The data suggests we’ve reached the inflection point where policy is accelerating an already inevitable transition.
The evidence converges on a single, unavoidable conclusion: solar energy has transitioned from an aspirational technology to an economic and environmental imperative. The cost curves, climate data, grid performance metrics, and adoption trajectories examined throughout this analysis paint a picture not of future potential, but of present reality.
We have crossed multiple thresholds simultaneously. Solar installations now deliver electricity at prices fossil fuels cannot match in most markets. The technology reliably powers grids with penetration rates exceeding 30 percent without compromising stability. Innovation continues to accelerate efficiency gains while manufacturing scale drives costs downward. Policy frameworks worldwide have shifted from tentative support to aggressive deployment targets backed by substantial capital.
The question facing utilities, businesses, policymakers, and homeowners is no longer whether solar energy deserves a place in our energy mix. The data settles that debate definitively. What remains unresolved is the pace at which we execute the transition. Every delayed installation, every postponed policy, every deferred grid upgrade extends our dependence on energy sources that are simultaneously more expensive and more damaging.
The renewable energy transition is not a distant goal requiring sacrifice and patience. It is an ongoing shift driven by fundamental economics, supported by mature technology, and demanded by physical reality. Your engagement with this transition, whether through adoption decisions, advocacy, or resource allocation, determines not if we reach a clean energy future, but how much unnecessary cost and damage we accumulate along the way.